Call us now :07971189175

 Send Inquiry
Sigmaplot Software
MOQ : 1 Piece
Sigmaplot Software Specification
- Interface Type
- Graphical User Interface (GUI)
- Usage
- Statistical Analysis, Data Visualization, Data Modeling
- Language Support
- English
- Compatible System
- Windows 7, 8, 10, 11
- Capacity (Person)
- Single User License
- Security Features
- License Activation and Serial Key Protection
- Support System
- Customer Support and Technical Assistance
- Type
- Data Analysis Software
- Application
- Scientific Data Analysis and Graphing
- Integration
- Works with Microsoft Office
- Installation Requirement
- 300 MB Free Disk Space
- Memory Requirement
- Minimum 2 GB RAM
- Help Resources
- Comprehensive User Manual and Online Tutorials
- Graph Types
- Over 100 2D and 3D Graph Types
- File Format Support
- SYSTAT, Excel, ASCII, Text, JPEG, TIFF, PNG, BMP
- Export Options
- Direct Export to PowerPoint and Word
- Update Method
- Automatic and Manual Updates
- Processor Requirement
- Intel Pentium 4 or Higher
- User Accessibility
- Accessible for Researchers, Educators, and Students
- Data Sharing
- Supports Cloud and Local Network Data Sharing
- Software Version
- SigmaPlot 14
- Customization
- Customizable Graph Templates
- License Type
- Standard, Academic, Site Licenses
Sigmaplot Software Trade Information
- Minimum Order Quantity
- 1 Piece
- Supply Ability
- 10 Pieces Per Week
- Delivery Time
- 4-12 Week
About Sigmaplot Software
Sigmaplot Software simplifies graph creation process with its easy to comprehend user interface. It offers advanced features like ribbon collection based control facility to select graphs as per individuals preference. Its graph wizard option assists its user in every step of graphics creation process. The user can generate attractive graphs and charts within limited time span. Its wide assortment of graph templates provides its user the opportunity to pick up most relevant technical graph design. In fact, it acts as a reliable and cost effective solution to generate 3D data. Offered software also enables professionals to utilize asymmetric or standard symbols. The line thickness, font size and color of graphs can also be modified with this software. We are an eminent trader and supplier of Sigmaplot Software.
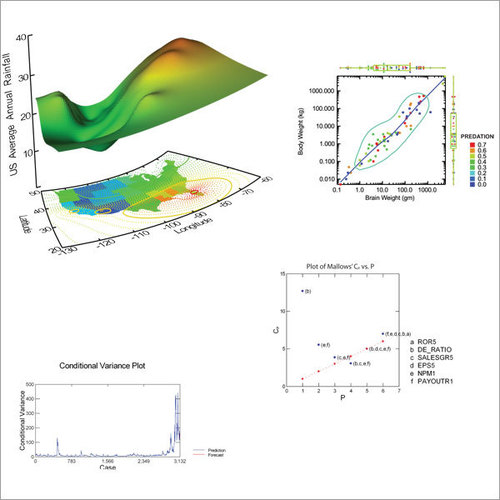
Extensive Graphing and Analysis Capabilities
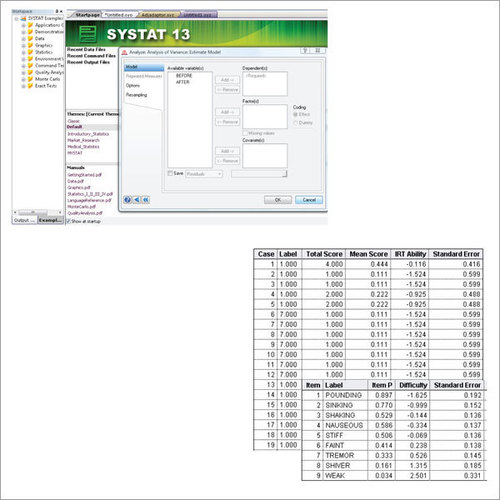
SigmaPlot 14 boasts an array of more than 100 2D and 3D graph types for comprehensive data visualization. The software supports scientific and statistical analysis, making it a valuable tool for research institutions and educational environments. User-friendly templates allow customization, ensuring tailored presentations that meet professional standards.
Flexible Data Import and Export Options
Users can import data from popular file formats including SYSTAT, Excel, ASCII, and text files. Exporting graphs is streamlined with direct support for PowerPoint and Word, as well as standard image formats like JPEG, TIFF, PNG, and BMP. This flexibility simplifies collaboration and communication of results in diverse workflows.
Seamless Integration and User Support
SigmaPlot integrates smoothly with Microsoft Office, enhancing workflow efficiency for various statistical and graphing tasks. The software provides a comprehensive user manual, online tutorials, and reliable customer support, ensuring users can readily access assistance and optimize their use of the application.
FAQs of Sigmaplot Software:
Q: How can users import data into SigmaPlot 14?
A: SigmaPlot 14 enables users to import data from SYSTAT, Excel, ASCII, and text file formats. Simply use the import function in the graphical user interface to access and integrate your datasets for analysis and graphing.Q: What types of graphs can be created with SigmaPlot 14?
A: SigmaPlot 14 allows creation of over 100 distinct 2D and 3D graph types. These include scatter plots, line graphs, bar charts, contour plots, and surface charts, catering to diverse scientific visualization needs.Q: When should I perform a software update, and how is it done in SigmaPlot 14?
A: Regular updates ensure optimal performance and access to new features. SigmaPlot offers both automatic and manual update options; users can initiate updates through the settings menu or enable automatic updates for convenience.Q: Where can SigmaPlot 14 be integrated for improved workflow?
A: SigmaPlot 14 integrates with Microsoft Office, allowing users to export graphs directly into PowerPoint and Word documents. This facilitates seamless inclusion of visual data in reports and presentations.Q: What is the process for activating a SigmaPlot 14 license?
A: License activation in SigmaPlot 14 requires entering a valid serial key. During installation, follow the activation prompts and input your key to securely enable your license, protected by SigmaPlots security features.Q: How does SigmaPlot 14 support data sharing and collaboration?
A: SigmaPlot 14 supports data sharing through cloud and local network options. Users can exchange datasets efficiently, fostering collaborative analysis among researchers or teams.Q: What are the benefits of using SigmaPlot 14 for scientific analysis?
A: SigmaPlot 14 provides advanced statistical analysis and modeling tools, extensive graph diversity, customizable templates, and robust export options. These features equip researchers, educators, and students to handle complex data visualization tasks and enhance scientific communication.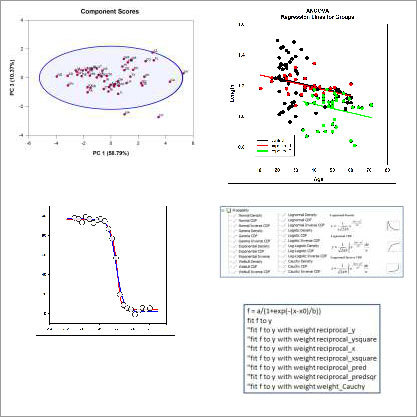
Tell us about your requirement

Price:
Quantity
Select Unit
- 50
- 100
- 200
- 250
- 500
- 1000+
Additional detail
Mobile number
Email

More Products in Systat Software Category
Systat 13 Software
Price Range 50000.00 - 500000.00 INR / Piece
Minimum Order Quantity : 1 Piece
Type : Other, Statistical Analysis Software
Interface Type : Graphical User Interface (GUI)
Usage : Professional, Academic, and Research Use
Language Support : English
Systat Statistical Software
Price Range 50000.00 - 500000.00 INR / Piece
Minimum Order Quantity : 1 , , Piece
Type : Other, Statistical Software
Interface Type : Graphical User Interface (GUI)
Usage : Data Science, Academic Research, Industrial Statistics
Language Support : English
We are providing our products across India.
Our Products

B-302, Taj Enclave, Geeta Colony,Delhi - 110031, India

 Send Inquiry
 Send SMS
Developed and Managed by Infocom Network Private Limited.
